
Wednesday, 12:00pm
11 July 2012
Big business, big world

Herbert Bayer’s World Geo-Graphic Atlas, 1953 – infodesign in Eye 82
Long before multinational corporations discovered the usefulness of corporate social responsibility (CSR) in ameliorating a public relations disaster, companies such as the Container Corporation of America (CCA) were pursuing the profit motive with a socially aware ethos embedded in practice, writes Peter Brawne in Eye 82.
Top: a spread early in the Atlas about the solar system shows the scale of the planets, including Earth, relative to the Sun – depicted dramatically as a huge red circle. Superimposed are black and white photographs of sunspots and a corona as well as background text about these features. At the top a diagram shows the distances of each planet from the Sun. Other early pages of the Atlas cover astronomy, geology and clouds, etc.
In 1949 Walter Paepcke, chairman of the Chicago-based manufacturer of corrugated boxes, asked Herbert Bayer to create a book that would reflect on the new geopolitical realities of the postwar world for CCA’s 25th anniversary in 1953.
Formerly director of advertising and printing at the Bauhaus, Bayer (1900-85) had emigrated from Berlin in 1938, after his work was included in the Nazi ‘Degenerate Art’ exhibition, and established a flourishing design practice in New York. For this project the Austrian designer supervised a team of three – Henry Gardiner, Masato Nakagawa and Martin Rosenzweig – over a four-year period.
The result is a stupendous object. Measuring 280 × 400mm high, the Atlas is housed within a cardboard slipcase printed in an enlarged moiré pattern that is repeated, in different colours, as the book’s endpapers. Bound in burlap with the title debossed and gilded to the front and spine, its 368 pages are printed in four-colour process plus six other spot colours, and gilt-edged.
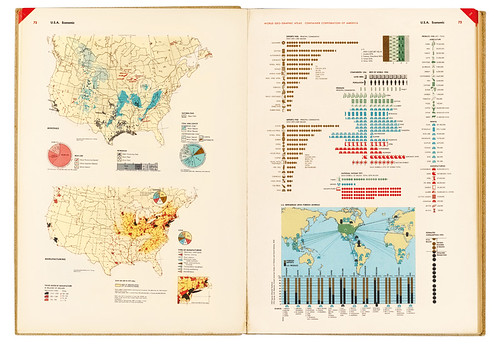
Above: top left map shows locations of mineral deposits – pink: iron ore; black: petroleum; blue: coal and lignite. Underneath, two pie charts and a bar indicate which US states are the most productive. The map below shows the locations where manufacturing has added value and areas of greatest manufacturing intensity. Small pie charts break these down by sector: machinery and metal goods, textiles and clothing, etc. The right-hand page compares exports (top left) with imports (below). Each commodity – machinery, cotton, automobiles – is given an icon, with every dot thereafter representing $50m. The map beneath this indicates us dependence on foreign minerals, relative to internal production, and where these come from. Integrated into the map, a set of bar graphs divided by mineral and showing actual (1949) and projected (1975) values use brown to show imports and black to indicate us production. In the middle of the page comparisons are made between the us (ranged right to the gap) and the rest of the world (ranged left from the gap). Arranged in horizontal rows, icons repeat as necessary – each represents ten percent of the world’s total – to indicate land mass, population, wheat, corn, cotton, etc.
As well as detailed maps, the Atlas’s double-page spreads employ and combine more than 2200 diagrams, graphs, charts, illustrations and symbols. The modern language and grammar of Isotype sits adjacent to old engravings of a sheaf of corn, or animals, while great swirls of overprinted shapes fuse with Buckminster Fuller’s Dymaxion projections and sans serif asymmetrically arranged text.
The book was given to customers and distributed free to more than 150 colleges and universities across the United States. It cost the CCA more than half a million dollars.
The Atlas’s underlying imperative to protect and preserve the planet prefigured contemporary concerns about ecology and finite resources. ‘Swiftly spreading global communications and increasing interdependence of all peoples compel us to consider the world as one,’ Bayer said. ‘This Atlas places emphasis on the physical and material background against which man is set.’ The Geographical Review in 1955 described it as ‘the handsomest and best atlas ever published in America’. Few atlases produced since that time convey so much with such clarity of purpose.

Above: around a third of the atlas is devoted to the US, signalled by bled-off red ‘flashes’ at the top corner of each page. In most cases each state is given a double-page spread with a conventional (though very detailed) map occupying the right hand page and generic information on the left. This page on Texas includes depictions of the state seal, the head of a Texas longhorn and a rattlesnake, with data that combines words, icons and dots to show the value of farm marketing produce (green), mineral production (blue) and manufacturing (red).
World Geo-Graphic Atlas: A Composite of Man’s Environment. Edited and designed by Herbert Bayer. Published in 1953 by the Container Corporation of America.
From ‘Big business, big world’, another part of ‘The graphic power of knowledge’ published in Eye no. 82 vol. 21, 2012.
Eye is the world’s most beautiful and collectable graphic design journal, published quarterly for professional designers, students and anyone interested in critical, informed writing about graphic design and visual culture. It is available from all good design bookshops and online at the Eye shop, where you can buy subscriptions and single issues. Eye 82 is out now, and you can browse a visual sampler at Eye before You Buy. Eye 83 is on its way to subscribers worldwide – thanks for your patience.