Monday, 7:39am
25 June 2012
Lady with the diagram

Florence Nightingale on Crimean War mortality, 1858 – infodesign in Eye 82

The vision of Florence Nightingale (1820-1910) as ‘The Lady with the Lamp’, doing ward rounds in her Crimean war hospital, is embedded in the British psyche, writes Anne-Marie Conway in Eye 82.
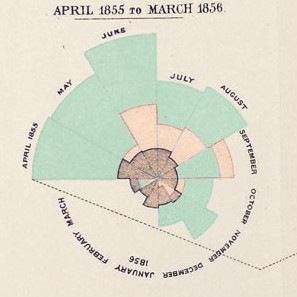
But her contribution to information design was her use of the polar-area diagram later known as the ‘Nightingale Rose’.
In her first winter at Scutari’s military hospitals, ten times more soldiers died of infectious disease than from wounds received in battle. Later (and dramatic) improvement came only after a sanitary commission improved ventilation and had faulty sewers flushed out.
Back in England, gathering information for a royal commission on the health of the army, Nightingale compared her records with William Farr’s mortality tables for the general population. She concluded that soldiers were twice as likely to die of disease as civilians – even in peacetime.
Her Notes on Matters Affecting the Health, Efficiency and Hospital Administration of the British Army: Founded Chiefly on the Experience of the Late War was published in 1858. Fearing that the statistics might seem ‘dry’, she included visual representations of the data.
For the Diagram of the Causes of Mortality in the Army in the East, she plotted the data clockwise on two connected circular charts, with 30-degree segments representing each month. For each month, causes of death were shown in superimposed wedges: coloured blue for ‘preventible or mitigable zymotic diseases’ (such as cholera and dysentery), red for ‘wounds’ and black for ‘all other causes’.
It is immediately obvious that deaths multiply after the troops arrive in Bulgaria in July 1854. It is equally clear that disease, not the Russians, was the real enemy. Only in the last month of the siege of Sevastopol did deaths from battle injuries exceed all others.
Nightingale’s chart has its flaws – there has been much argument about the proportionality of the wedges, since the data plots to the radius only, thus overdramatising the outer areas, for instance. But it certainly got her message through: after a decade of sanitary reform, British army deaths in India fell by 75 per cent. In the year it was published, she became the first woman elected to the Royal Statistical Society.
From ‘Lady with the diagram’, another part of ‘The graphic power of knowledge’ published in Eye no. 82 vol. 21, 2012.
Eye is the world’s most beautiful and collectable graphic design journal, published quarterly for professional designers, students and anyone interested in critical, informed writing about graphic design and visual culture. It is available from all good design bookshops and online at the Eye shop, where you can buy subscriptions and single issues. Eye 82 is out now, and you can browse a visual sampler at Eye before You Buy. Eye 83 will be on press this week.


