Winter 2011
Networks map a complex world

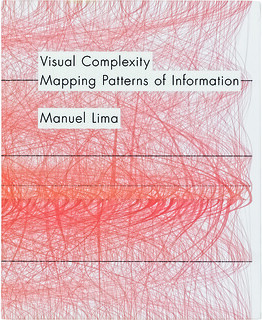
Visual Complexity: Mapping Patterns of Information
By Manuel Lima <br>Princeton Architectural Press, $50<br>

VisualComplexity.com, founded by Manuel Lima in 2005, is a repository of experimental visual mapping of complex networks. Among the many projects indexed there (more than 770 at the time of writing), the website displays a wide variety of visualisations across fields such as biology, physics, ecology, computer science, sociology, news and government data. Examples include the relationship between scientific disciplines; GPS co-ordinates and the speed of taxis; internet connectivity; terrorist affiliations; and a wide variety of other applications.
Lima’s book distils lessons from this enormous Web-based project and establishes themes, principles and best practice. In the foreword, Lev Manovich explains that information visualisation and networks science are ‘two key techno-cultural phenomena of our time’. These fast-moving fields facilitate the perception of structure and dynamics in complex systems. Both network science and information visualisation hold the potential to address communication problems in the face of ever-increasing complexity, and Lima does an admirable job of documenting this emerging field of practice.
Visual Complexity’s first chapters chart the development of visual representation of networks from simple tree diagrams to Mark Lombardi’s stunning network diagrams of corruption in finance and political circles in America. This part of the book is vast in scope and would be fascinating even without the illustrations – gems ranging from early diagrams of scientific classifications, such as Christophe de Savigny’s Geometry (1587) and Ernst Haeckel’s General Morphology of Organisms (1866), to recent masterpieces such as Mapping Scientific Paradigms by W. Bradford Paley, Dick Klavans and Kevin Boyack (2006).
The exploration of visual metaphors as a means of organising information reflects changes in our way of knowing; and so the change from tree to metaphor has profound epistemological implications, as networks enable a greater engagement with and understanding of complexity. For Lima, network visualisation is not only a means for the representation of information but also a tool for analysis. And, as he explains in the chapter titled ‘Complex Beauty’, it is contributing to a shift in our conception of reality while also expressing a new sense of beauty (as visible in the Networkism art movement).
The most useful chapter for practising graphic designers is likely to be the one boldly titled ‘The Syntax of a New Language’. Here Lima identifies fifteen basic types of network depictions, including arc diagrams, circled globes, flow charts, organic rhizomes, radial implosions and spheres, and explores exactly how different strategies work to map information. This overview of methods will undoubtedly serve as inspiration for future work by designers struggling with the process of visualising complex information.
This book is, to my knowledge, the first attempt to describe typologies, principles and concepts in the visualisation of networks. However, it is somewhat diminished by Lima’s rather uncritical optimism and he undermines his own insistence on relevance as a principle for information visualisation by devoting so much space to trivial (if beautiful) examples. Readers interested in the purpose of network visualisation will find more of a sense of gravitas in the contributions to the final chapter ‘Looking Ahead’.
Christopher Kirwan, for example, appeals for a cybernetic response to augment humanity’s collective intelligence. He correctly identifies visualisation as capable of functioning as critical feedback mechanisms to focus attention on global dilemmas, such as the fact that ‘our biological system is reaching its tipping point and is in imminent danger of failure’. While some of his assumptions on humankind’s capacity to ‘manage’ complexity are questionable, Kirwan’s essay helps the field move towards meaningful purposes.
The crowning essay is David McConville’s ‘Reflexive Ecologies: Visualizing Priorities’, which succinctly describes ‘the power of imagery to profoundly affect our sense of place’ thereby ‘illuminating the most complex and important network of all: Earth’s biosphere’.
Overall, the book demonstrates how network visualisation can counter the legacy of fragmented approaches to knowledge, and examines its potential to support relational thinking. Visual Complexity shows us how this new field can augment our understanding of both natural phenomena and human-made systems.
Cover shows Borris Muller’s visualisation of the 35,558 words in Lima’s book.
Top: CMM Infographic by Juan Pablo de Gregorio and José Neira and Liveplasma by Frederic Vavrille.

J.J. Boehnert, writer, designer, researcher, founder Eco Labs, London
First published in Eye no. 82 vol. 21 2012
Eye is the world’s most beautiful and collectable graphic design journal, published quarterly for professional designers, students and anyone interested in critical, informed writing about graphic design and visual culture. It is available from all good design bookshops and online at the Eye shop, where you can buy subscriptions, back issues and single copies of the latest issue.

